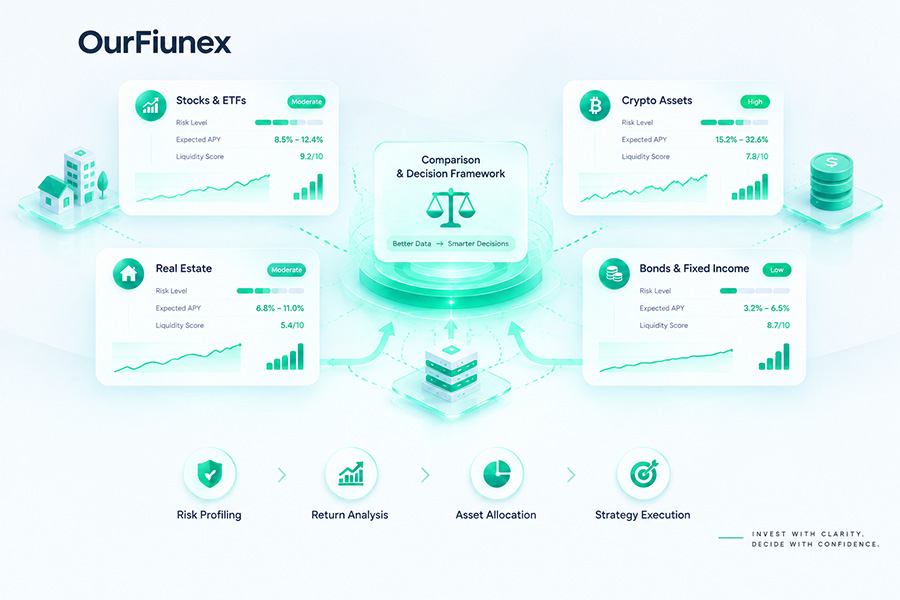
Choosing between different investment options can be difficult.
Stocks, bonds, Forex, gold, cryptocurrencies, real estate, ETFs, and automated trading strategies all have different characteristics. They can vary significantly in terms of risk, potential return, liquidity, time horizon, fees, volatility, and complexity.
Instead of asking “Which investment is the best?”, a more useful question is:
“Which investment characteristics match my goals, time horizon, and risk tolerance?”
A structured comparison framework can make this process much easier.
In this guide, we explain how to compare investment options using a consistent set of criteria and how automated and AI-powered trading strategies can fit into a broader investment analysis framework.
What Is an Investment Comparison Framework?
An investment comparison framework is a structured method for evaluating different investment opportunities using the same criteria.
Rather than comparing investments based on a single number such as historical return, an investment framework considers multiple dimensions.
A practical framework can include:
- Investment objective
- Time horizon
- Risk
- Historical performance
- Volatility
- Maximum drawdown
- Liquidity
- Costs and fees
- Diversification
- Complexity
- Accessibility
- Tax considerations
- Investment management requirements
The purpose is not to produce a universal winner.
Instead, the framework helps investors understand the differences between available options.
Why You Should Not Compare Investments Based Only on Returns
One of the most common mistakes when comparing investments is focusing exclusively on historical returns.
Imagine two hypothetical investments:
| Investment | Historical Return | Maximum Drawdown |
|---|---|---|
| Investment A | 30% | 28% |
| Investment B | 18% | 8% |
Investment A generated a higher historical return, but it also experienced a substantially larger decline.
Looking only at return would hide an important part of the comparison.
This is why return and risk should be evaluated together.
Historical performance is also not a guarantee of future results.
The Investment Options Comparison Framework
Let’s look at the main criteria one by one.
1. Define the Investment Objective
Before comparing investments, define what the capital is intended to accomplish.
Possible objectives include:
- Long-term wealth accumulation
- Capital preservation
- Income generation
- Short-term trading
- Portfolio diversification
- Retirement planning
- Exposure to a specific market
- Automated trading
Different objectives can lead to very different investment choices.
For example, an investor looking for long-term growth may evaluate an opportunity differently from someone interested in short-term trading.
2. Consider Your Time Horizon
Time horizon refers to how long you expect to keep your money invested.
Common categories include:
Short-Term
Usually measured in months or a few years.
Liquidity and short-term volatility can be particularly important.
Medium-Term
Often several years.
The investor may have more flexibility to tolerate temporary market fluctuations.
Long-Term
Typically many years or decades.
Long-term investors may place greater emphasis on growth potential, diversification, fees, and the ability to withstand temporary declines.
The appropriate time horizon depends on the individual’s objectives and circumstances.
3. Evaluate Risk
Risk is one of the most important factors when comparing investment options.
However, risk is not represented by a single metric.
Different investments can expose investors to different types of risk.
These may include:
- Market risk
- Credit risk
- Liquidity risk
- Currency risk
- Leverage risk
- Operational risk
- Technology risk
- Regulatory risk
- Concentration risk
For trading-based investments, additional considerations may include execution risk and strategy risk.
4. Analyze Volatility
Volatility describes how significantly the value of an investment can fluctuate over time.
An investment with high volatility can experience large price movements over relatively short periods.
For example:
- Stocks can experience significant daily price movements.
- Cryptocurrencies can experience particularly large fluctuations.
- Gold can respond to changes in economic and geopolitical conditions.
- Forex markets can react quickly to interest rates and economic data.
- Automated trading strategies can have periods of both gains and losses.
Volatility should be considered alongside the investor’s time horizon and risk tolerance.
5. Look at Maximum Drawdown
Maximum drawdown is particularly useful when evaluating trading strategies.
It measures the largest decline from a previous peak during a specific period.
For example, if an account rises from $10,000 to $15,000 and subsequently falls to $11,000, the drawdown from that peak is approximately 26.7%.
Maximum drawdown helps illustrate how difficult it may have been to remain invested during a historical period.
For automated trading strategies, drawdown can be especially important because two strategies with similar returns may have very different risk profiles.
6. Compare Historical Performance
Historical performance can provide useful information, but it needs context.
When reviewing performance, consider:
- Measurement period
- Market conditions
- Number of observations
- Volatility
- Drawdown
- Fees
- Leverage
- Strategy changes
Avoid evaluating an investment solely based on its best historical period.
A longer performance history can provide more context, although it still cannot predict future results.
7. Understand the Difference Between Return and Risk-Adjusted Return
Two investments can have similar returns while exposing investors to different levels of risk.
Risk-adjusted performance attempts to evaluate returns in relation to the amount of risk taken.
Common metrics include:
Sharpe Ratio
The Sharpe ratio compares excess return with volatility.
A higher value can indicate more return relative to the measured volatility, although the metric has limitations and should not be used by itself.
Sortino Ratio
The Sortino ratio focuses more specifically on downside volatility.
Profit Factor
Profit factor is commonly used when evaluating trading strategies.
It compares gross profits with gross losses.
These metrics can provide additional context when analyzing automated trading systems.
8. Evaluate Liquidity
Liquidity refers to how easily an investment can be bought or sold without significantly affecting its price.
Highly liquid markets generally have many participants and substantial trading activity.
Liquidity can matter because investors may need to access their capital quickly.
Consider:
- Trading volume
- Bid-ask spread
- Market hours
- Withdrawal rules
- Settlement periods
- Lock-up periods
An investment that appears attractive but is difficult to exit may not be suitable for every investor.
9. Compare Fees and Costs
Investment performance should be evaluated after considering relevant costs.
Depending on the investment, costs may include:
- Management fees
- Trading commissions
- Spreads
- Performance fees
- Withdrawal fees
- Platform fees
- Custody fees
- Financing costs
- Currency conversion costs
For active or automated trading, transaction costs can become particularly important because frequent trading may generate more spreads and commissions.
10. Examine Leverage
Leverage allows traders to control a larger position using a smaller amount of capital.
It can increase exposure to a market and can magnify both gains and losses.
For this reason, leveraged investments should be evaluated differently from unleveraged investments.
When comparing trading strategies, consider:
- Maximum leverage
- Margin requirements
- Position size
- Maximum exposure
- Stop Loss methodology
- Margin-call policies
High historical returns should not be viewed independently from the amount of leverage used to achieve them.
11. Evaluate Diversification
Diversification means spreading exposure across different investments, markets, sectors, regions, or strategies.
A portfolio may contain different asset classes such as:
- Equities
- Bonds
- Gold
- Cash
- Real estate
- Commodities
- Alternative investments
- Trading strategies
However, simply owning multiple assets does not automatically create effective diversification.
Two investments can behave similarly and therefore provide limited diversification benefits.
Correlation between investments is an important consideration.
12. Compare Active and Passive Approaches
Investment approaches can broadly be divided into active and passive strategies.
Active Investing
An active strategy attempts to make decisions that can influence performance relative to a benchmark or market.
Examples can include:
- Active stock selection
- Discretionary trading
- Algorithmic trading
- Forex strategies
Passive Investing
A passive strategy generally attempts to track a market index or predefined benchmark.
Examples include many index funds and ETFs.
Neither approach should be evaluated solely by its label.
Consider costs, risk, objectives, diversification, and historical behavior.
13. Compare Manual Trading With Automated Trading
For investors interested in financial markets, automated trading introduces another dimension to the comparison.
Manual trading requires the trader to make and execute decisions.
Automated trading uses software to execute predefined trading rules.
An automated strategy may:
- Analyze market data
- Generate trading signals
- Open positions
- Close positions
- Set Stop Loss
- Set Take Profit
- Adjust position sizes
- Apply risk-management rules
Automation can improve consistency and reduce manual execution, but it does not eliminate market risk.
14. Evaluate AI Trading Strategies
AI-powered trading introduces another category to the investment comparison framework.
An AI trading system may use algorithms or machine-learning techniques to analyze market information and generate trading decisions.
Potential inputs can include:
- Price data
- Historical data
- Technical indicators
- Volatility
- Market structure
- Trading volume
- Other structured market information
However, the term AI alone does not tell you whether a strategy is reliable.
When evaluating an AI trading strategy, investigate:
- How the strategy works
- What data it uses
- How it was tested
- How it manages risk
- Historical drawdown
- Number of trades
- Testing period
- Out-of-sample results
- Execution conditions
15. Compare Investment Options With a Standard Scorecard
A simple scorecard can make comparisons easier.
For example:
| Criterion | Stocks | Bonds | Gold | Forex Trading | AI Trading Strategy |
|---|---|---|---|---|---|
| Growth potential | Varies | Varies | Varies | Strategy-dependent | Strategy-dependent |
| Volatility | Varies | Generally lower | Varies | Can be high | Strategy-dependent |
| Liquidity | Generally high | Varies | Generally high | Generally high | Depends on underlying market |
| Leverage | Usually limited | Usually limited | Depends on instrument | Commonly available | Strategy-dependent |
| Automation | Available | Available | Available | High potential | Core feature |
| Management required | Varies | Low to medium | Low to medium | Medium to high | Potentially lower |
| Drawdown | Market-dependent | Market-dependent | Market-dependent | Strategy-dependent | Strategy-dependent |
| Complexity | Medium | Low to medium | Low to medium | High | High |
This table is not intended to rank the investments.
Instead, it demonstrates why comparing investments requires multiple dimensions.
A Better Way to Compare Investment Opportunities
A useful comparison process can follow five stages.
Stage 1: Define Your Requirements
Write down:
- Investment objective
- Time horizon
- Liquidity requirements
- Risk tolerance
- Available capital
- Desired level of involvement
Stage 2: Eliminate Incompatible Options
If an investment does not match your time horizon, liquidity requirements, or risk tolerance, it may not belong in the final comparison.
Stage 3: Analyze Historical Data
Review available historical performance and risk metrics.
Look at multiple periods instead of a single favorable period.
Stage 4: Compare Costs and Risks
Calculate the impact of:
- Fees
- Spreads
- Commissions
- Leverage
- Drawdown
- Taxes where applicable
Stage 5: Review the Complete Picture
Finally, compare each remaining option across the same criteria.
The objective is to understand the trade-offs rather than reduce the decision to one number.
Example: Comparing a Traditional Investment With an AI Trading Strategy
Consider a hypothetical investor comparing a traditional market investment with an AI-powered trading strategy.
The investor might evaluate:
Return
What has the investment historically returned?
Drawdown
What was the largest historical decline?
Volatility
How significantly did its value fluctuate?
Liquidity
How easily can capital be accessed?
Fees
What are the total ongoing and transaction costs?
Time Commitment
How much involvement is required?
Transparency
How clearly can the investor understand the strategy and its performance?
Risk Controls
What mechanisms exist to limit excessive exposure?
This framework provides a more complete comparison than simply asking which option generated the highest return.
Investment Comparison Checklist
Before making an investment decision, consider asking:
- What is my primary investment objective?
- What is my time horizon?
- How much volatility can I tolerate?
- How much capital can I afford to lose?
- How liquid is the investment?
- What are the total fees?
- Is leverage involved?
- What is the historical maximum drawdown?
- How long is the available performance history?
- How diversified is the investment?
- How transparent is the strategy?
- How much management does it require?
- What risks could cause the investment to underperform?
- How does it fit with my existing portfolio?
The answers can help create a more complete picture.
Common Mistakes When Comparing Investments
Focusing Only on Historical Returns
Historical returns are useful but incomplete.
Always consider risk and the period over which the return was generated.
Ignoring Fees
Small recurring costs can have a significant impact over long periods.
Comparing Different Risk Levels
A highly leveraged trading strategy should not be compared with a low-risk asset using return alone.
Ignoring Liquidity
An investment may have attractive characteristics but still be unsuitable if capital cannot be accessed when needed.
Using Too Little Data
Short periods can produce misleading conclusions.
Assuming AI Means Low Risk
Artificial intelligence does not remove market uncertainty.
An AI trading strategy can still experience losing periods and drawdowns.
Ignoring Correlation
Holding multiple investments does not necessarily mean that a portfolio is diversified.
How AI Can Change Investment Analysis
Artificial intelligence can potentially help investors analyze larger amounts of information and automate parts of the research process.
Applications may include:
- Market screening
- Pattern detection
- Portfolio analytics
- Risk monitoring
- Automated trading
- Strategy testing
- Trade execution
- Performance analysis
However, AI should be considered a tool rather than a guarantee of investment success.
The quality of the data, model, strategy, implementation, and risk-management framework remains important.
How OurFiunex Fits Into the Investment Comparison Framework
OurFiunex focuses on AI-powered trading, automated strategies, and copy trading.
For users evaluating automated trading strategies, the comparison framework described above can be applied to strategy performance and risk data available through the platform.
Instead of focusing exclusively on historical returns, users can examine characteristics such as:
- Historical performance
- Drawdown
- Trading activity
- Risk characteristics
- Strategy behavior
- Market exposure
- Automated execution
This approach can help users understand an AI trading strategy within a broader decision-making framework.
OurFiunex is designed to make automated strategies more accessible while providing information that can help users evaluate strategy behavior.
Frequently Asked Questions
What is the best way to compare investment options?
Use a consistent framework that considers objectives, time horizon, risk, historical performance, volatility, drawdown, liquidity, costs, diversification, and complexity.
Should I compare investments based on return?
Return is an important factor, but it should not be considered alone. Risk, drawdown, volatility, fees, and liquidity can significantly change the overall picture.
What is the most important investment metric?
There is no single metric that is appropriate for every investment. The relevant metrics depend on the investment type and the investor’s objectives.
How do I compare AI trading strategies?
Compare historical performance, maximum drawdown, volatility, number of trades, risk management, trading costs, strategy methodology, and testing history.
Is AI trading less risky than traditional investing?
Not necessarily. AI can automate analysis and execution, but it does not eliminate market risk.
How important is diversification?
Diversification can reduce concentration in a particular asset, market, or strategy. However, the effectiveness of diversification depends on how the investments behave relative to one another.
Should I use leverage when investing?
Leverage increases market exposure and can magnify both gains and losses. Whether it is appropriate depends on the investment strategy and the individual’s circumstances.
Final Thoughts
There is no single framework that can determine the right investment for every person.
The more useful approach is to compare investment options using the same criteria and understand the trade-offs between return, risk, liquidity, cost, complexity, and time horizon.
For automated and AI-powered trading strategies, additional factors such as drawdown, leverage, execution, strategy transparency, and risk management become particularly important.
Whether you are comparing stocks, bonds, gold, Forex, cryptocurrencies, or AI trading strategies, a structured framework can help you move beyond headline returns and develop a more complete understanding of each opportunity.
Explore AI-powered trading and automated strategies with OurFiunex.
Risk Disclosure: Trading Forex, CFDs, cryptocurrencies, and other leveraged financial instruments involves substantial risk and may result in the loss of invested capital. Past performance does not guarantee future results. This article is for educational and informational purposes only and does not constitute investment, financial, or trading advice.